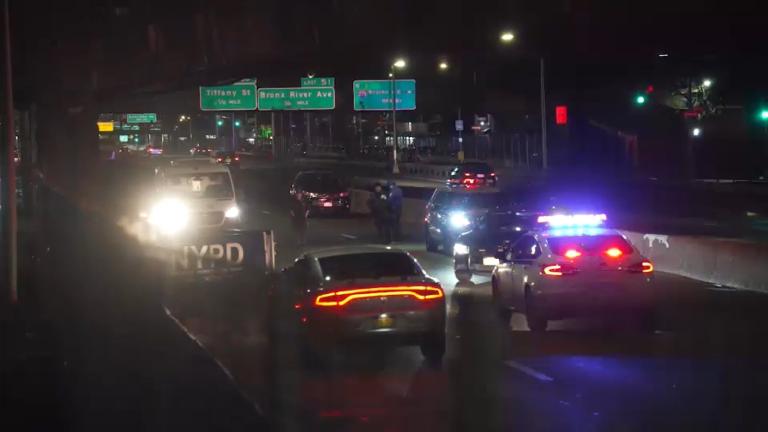
Midnight BMW strike kills man on East 222nd Street
A BMW driver killed a 27-year-old man at East 222nd Street and Boston Road. One week in the Bronx now holds one crash, one death, and one serious injury.
2025-11-29 → 2025-12-06
Counts come from NYC police crash reports (NYC Open Data). We sum all crashes, injuries, and deaths for this area across the selected time window shown on the card. Injury severity follows the official definitions in the NYPD dataset.
Change badges (arrows and percentages) compare the selected window with the same period last year whenever we have enough history. The “From 2022” view compares today’s totals with the earlier multi-year span. When a comparison window isn’t available the badge shows an em dash.
Notes: Police reports can be corrected after initial publication. Minor incidents without a police report are not included.
CloseToggle on at least one mode to see people totals.
Totals count people injured or killed. Use the mode filters above to focus the stacks.
This ranks vehicles by the number of NYC school‑zone speed‑camera violations they received in the last 12 months anywhere in the city. The smaller note shows how many times the same plate was caught in this area in the last 90 days.
Camera violations are issued by NYC DOT’s program. Counts reflect issued tickets and may omit dismissed or pending cases. Plate text is shown verbatim as recorded.
CloseIn one week the Bronx saw two crashes with two people killed and two seriously hurt. Both men were hit at night. Both drivers kept going straight. Police list causes only as unspecified.
In seven days the Bronx saw two severe crashes. Two people died. Two more were seriously hurt.
One night on the Bruckner Expressway a northbound SUV hit a man outside any crosswalk. The right front bumper struck him. He died at the scene. Police checked the boxes for “Unspecified” factors.
The next night on Grand Concourse near East 181st Street a southbound driver hit a man in the roadway. Center front impact. Crush injuries. He died too. Again the cause is only marked “Unspecified.”
Bronx leaders can push DOT and NYPD for slower speeds, safer crossings, and real redesigns on expressways and Grand Concourse now.
A BMW driver killed a 27-year-old man at East 222nd Street and Boston Road. One week in the Bronx now holds one crash, one death, and one serious injury.
Summary not available.
Summary not available.
Summary not available.
We group pedestrian injuries and deaths by the vehicle type that struck them (as recorded in police reports). Use the year selector to compare the current window with the prior period.
Notes: Police classification can change during investigations. Small categories may have year-to-year variance.
CloseBronx Bronx sits in District 11, AD 78, SD 29.
It contains Bronx CB1, Bronx CB2, Bronx CB3, Bronx CB4, Bronx CB5, Bronx CB6, Bronx CB7, Bronx CB8, Bronx CB9, Bronx CB10, Bronx CB11, Bronx CB12, Bronx CB26, Bronx CB27, Bronx CB28, District 11, District 12, District 13, District 14, District 15, District 16, District 17, District 18, District 8, Mott Haven-Port Morris, Melrose, Hunts Point, Longwood, North & South Brother Islands, Morrisania, Claremont Village-Claremont (East), Crotona Park East, Crotona Park, Concourse-Concourse Village, Highbridge, Mount Eden-Claremont (West), Yankee Stadium-Macombs Dam Park, Claremont Park, University Heights (South)-Morris Heights, Mount Hope, Fordham Heights, West Farms, Tremont, Belmont, University Heights (North)-Fordham, Bedford Park, Norwood, Kingsbridge Heights-Van Cortlandt Village, Kingsbridge-Marble Hill, Riverdale-Spuyten Duyvil, Soundview-Bruckner-Bronx River, Soundview-Clason Point, Castle Hill-Unionport, Parkchester, Soundview Park, Westchester Square, Throgs Neck-Schuylerville, Pelham Bay-Country Club-City Island, Co-op City, Hart Island, Ferry Point Park-St. Raymond Cemetery, Pelham Parkway-Van Nest, Morris Park, Pelham Gardens, Allerton, Hutchinson Metro Center, Williamsbridge-Olinville, Eastchester-Edenwald-Baychester, Wakefield-Woodlawn, Woodlawn Cemetery, Van Cortlandt Park, Bronx Park, Pelham Bay Park, Rikers Island, Precinct 40, Precinct 41, Precinct 42, Precinct 43, Precinct 44, Precinct 45, Precinct 46, Precinct 47, Precinct 48, Precinct 49, Precinct 50, Precinct 52.